Maps in R using ggplot2 and OSM packages
NHSE R drop in session
Pablo Leon |pablo.leonrodenas@nhs.net
Invalid Date
Intro
These slides were presented in the NHSE-R drop in session on Friday 26th May 2023.
In R we can plot geospatial data using several methods, today I will focus on static maps using ggplot2 and osm packages. Drawing maps usually imply these steps:
- Getting shapefiles to draw a map
- Obtaining metadata to plot on the map
- In R we load the multypoligon objects using
geom_sf() and coord_sf()
- Then we can take advantage of ggplot2 framework to overlay one map on top of another
An introduction to plotting maps in R using ggplot2 can be found on this online book: https://ggplot2-book.org/maps.html.
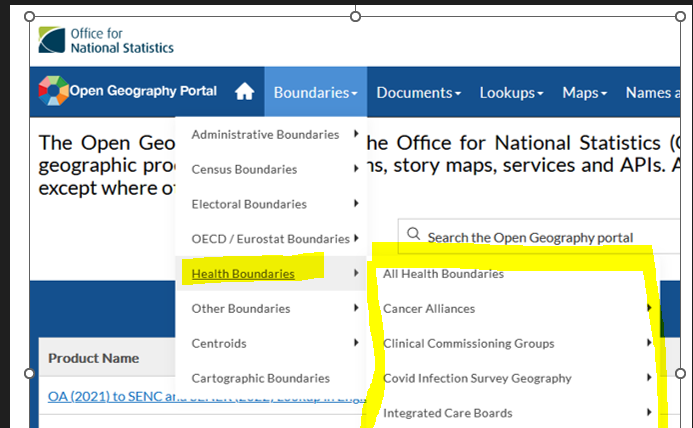
1. NHS Health boundaries
The Office for National Statistics provides a free and open access to several geographic products. There is a specific section for Health boundaries on their Open Geography Portal website: https://geoportal.statistics.gov.uk/.
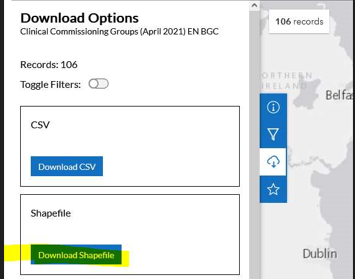
From Clinical Commissioning Groups section download 2021 Boundaries shapefile zipped file.
2. Unzip CCG boundaries into R
Load unzipped files into R using Open Geography Portal