NHS England R Community
Welcome to the NHS England R community documentation site
This site is open to all to share good practice, basic knowledge around access and using R across NHS England platforms, and creating a place for us to share our collective knowledge, code, resources and content.
The NHS England R Community is not intended to replace any other R user groups - there’s a fantastic national NHS-R Community and lots of local sharing of R work, we want to use this site to signpost to other resources for those specifically using R within NHS England.
It is a community - and we need your help
- Please share and invite other R users to our FutureNHS page
- Please use the forum, ask questions and engage!
- Please share code, your good practice examples, and your learning journey in our GitHub repository
What is R and why is it used at NHSE?
R is an open-source programming language that is widely used among statisticians and data scientists in the NHS. R has a large number of built-in functions and packages for statistical analysis and data visualisation. Along with tools such as Python1, R can be used to develop so-called reproducible analytical pipelines (RAP).
Reproducible analytical pipelines are the gold standard for creating analytical outputs in government2. It is a set of standards that promote best practice across the sector3. By following RAP we can be much more transparent with how we work, increasing trust and confidence in our publications, and make it easier for others to verify and replicate our analysis.
Example analytical reports
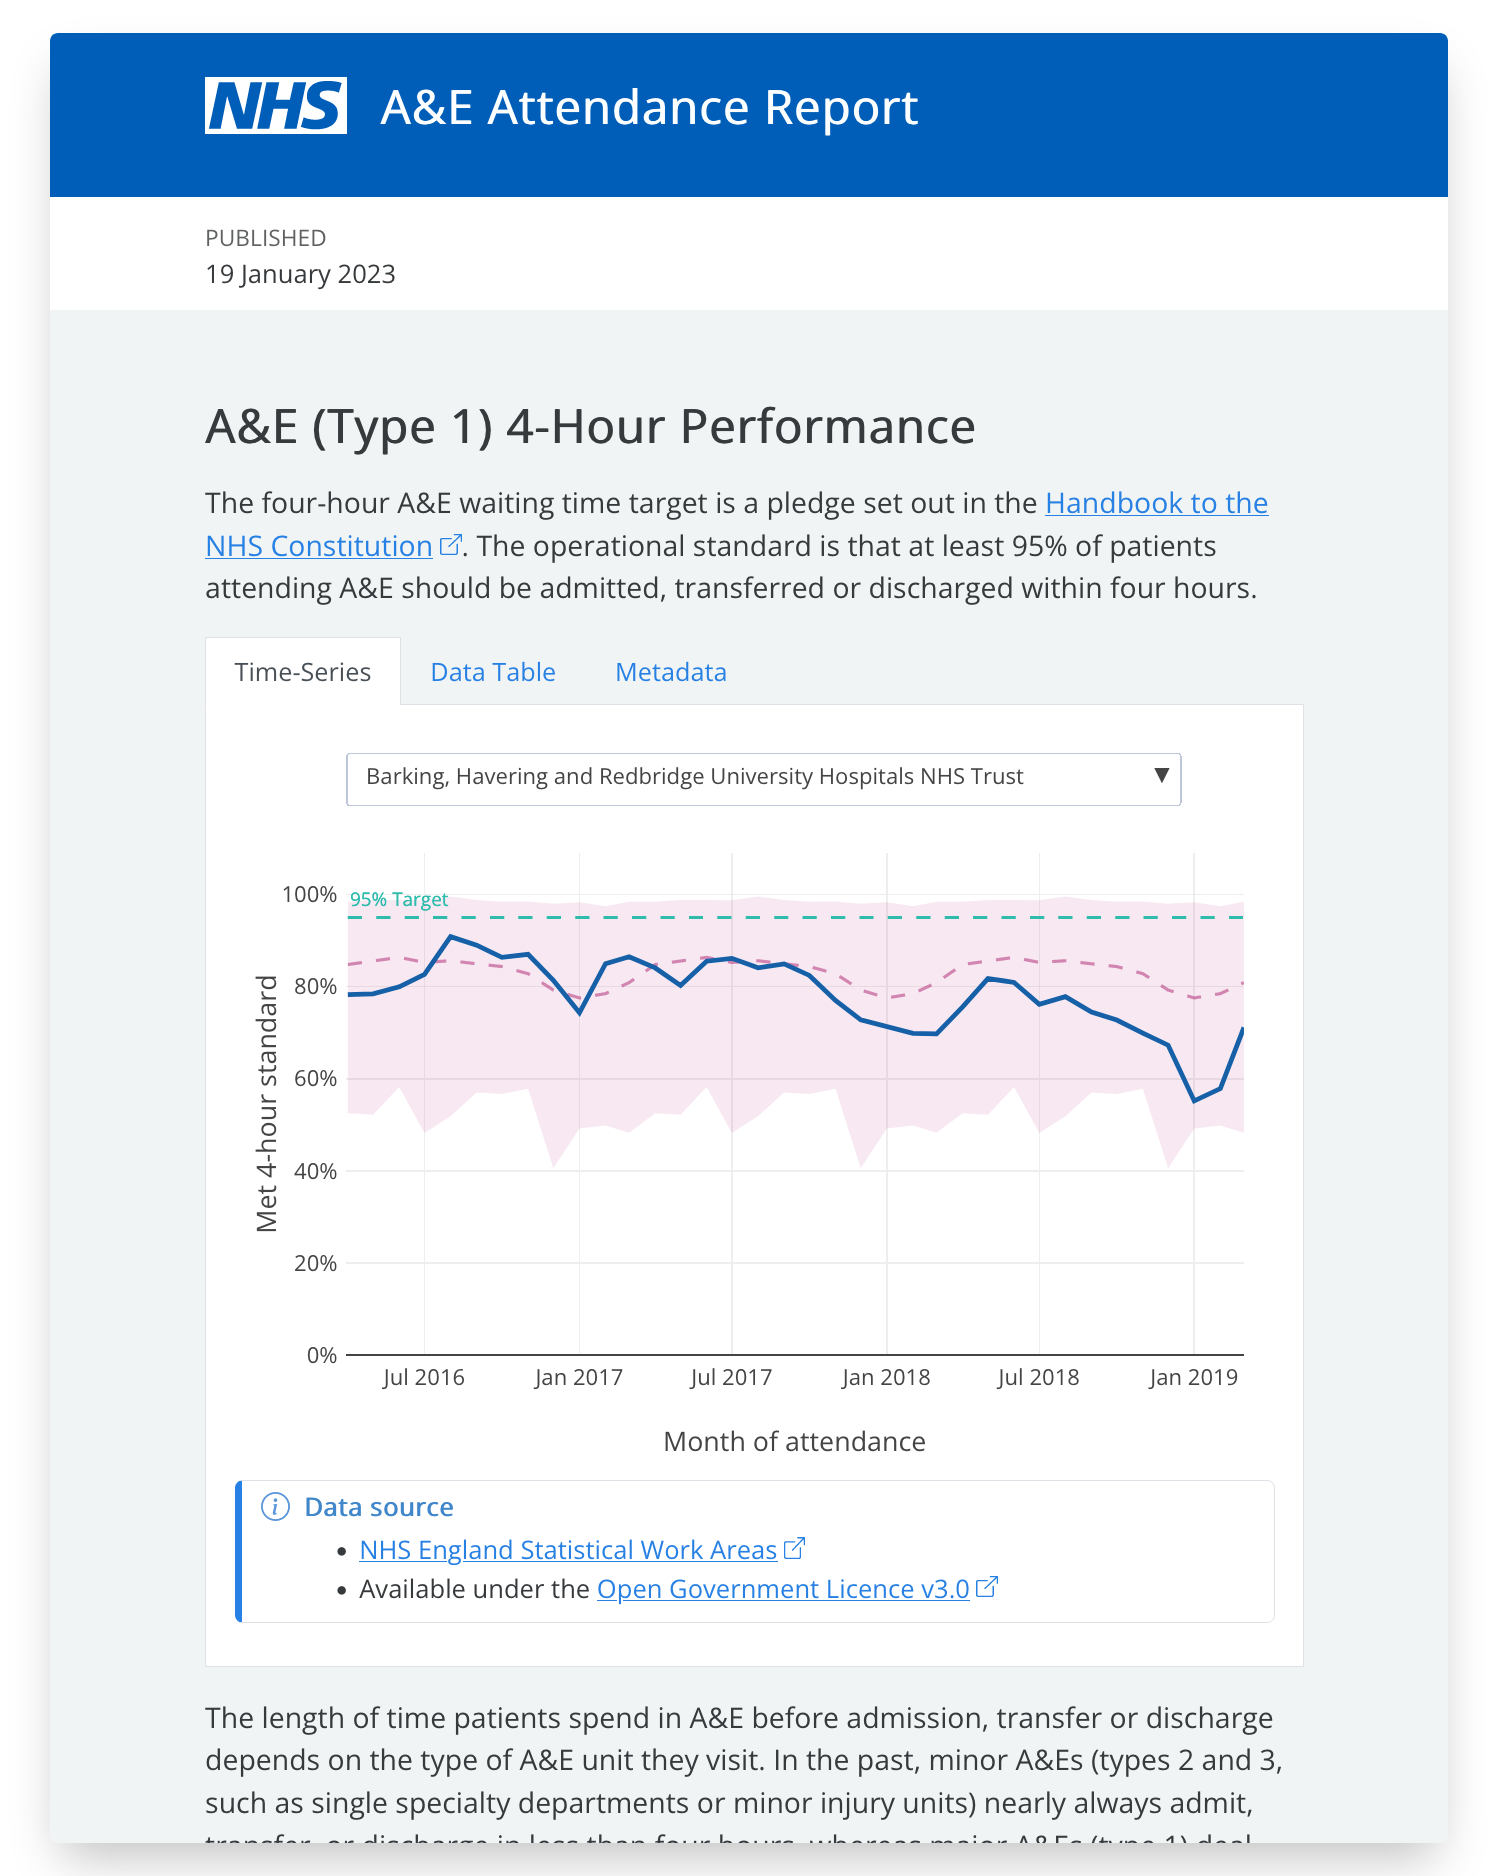
Below is an example of an analytical report that is fully open-source and RAP compliant developed using R, Quarto, and plotly, and open data from the NHS-R Community. The NHS theme used in this report is available on the NHS-R Community GitHub repository.
In development:
- These interactive html reports can be confiugured with parameters to create multiple versions of the same report, charts, and analyses but for different organisations
- Regions
- ICB / SICBL
- PCN / GP
- Trust / Ward etc
- Using {targets} we can define dependencies in the data processing stages and process these reports automatically when new data is available.
- A standard set of reporting charts and tables can be pre-configured using plotly, adjusting the colors, fonts, annotations, and labels to match the NHS style.
- A shared library of unit-tested functions allows complex analysis to be run with every calculation fully validated and documented.
- Quality assurance can also be built into these functions so that logging, data validation, and schema checks can be run to ensure that our data pipelines are functioning correctly, and all the data follows the correct structure and format.
Contributing
Contributions are what make the open source community such an amazing place to learn, inspire, and create. Any contributions you make are greatly appreciated.
See CONTRIBUTING.md for detailed guidance.
License
Distributed under the MIT License. See LICENSE.md for more information.
No private or patient data are shared in this repository.
Footnotes
See the NHS Python Community↩︎
See Professor Ben Goldacre’s Better, Broader, Safer review into how the efficient and safe use of health data for research and analysis can benefit patients and the healthcare sector.↩︎
See NHS Digital’s RAP Community of Practice guide on the levels of RAP.↩︎
